Example DifWrap Model Inspection Plots
(click on the images for the full resolution versions)
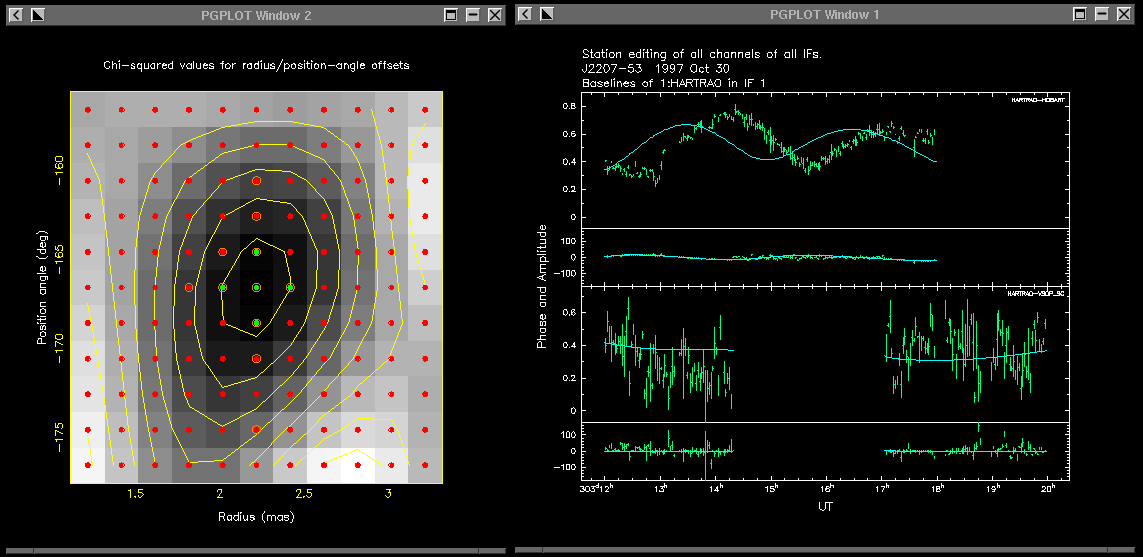
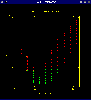
 Contour plot of Chi-squared of fit as a function of component position
(left) and corresponding plot of one trial model with the data (right)
.
Contour plot of Chi-squared of fit as a function of component position
(left) and corresponding plot of one trial model with the data (right)
.
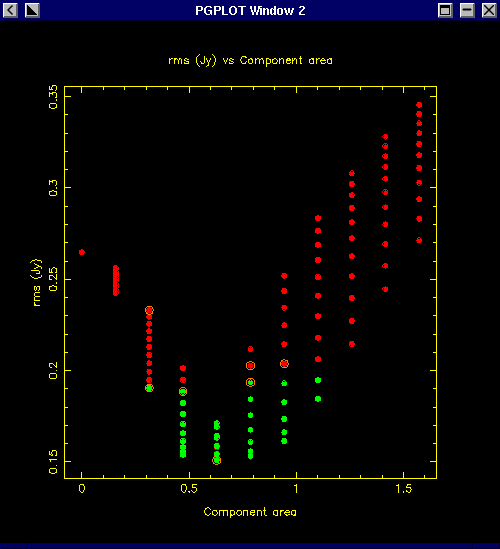
 rms of fit as a function of the area of the model component
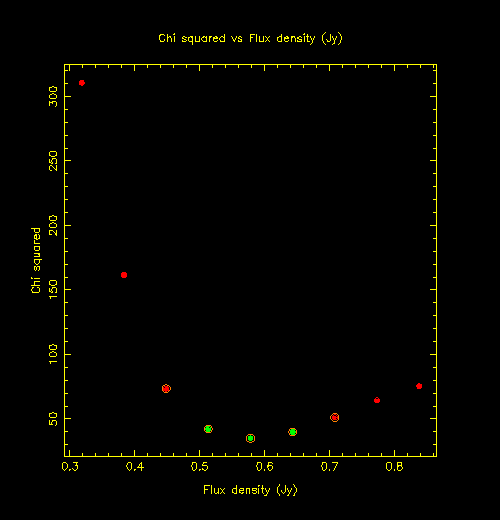
 Chi-squared of fit as a function of component flux density.
Jim Lovell jlovell@vsop.isas.ac.jp
1998-10-12