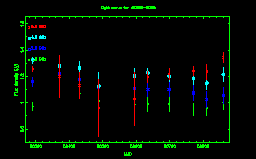
ATCA Flux Density Monitoring Data for J0309-6058
 |
ATCA Flux density light-curve. Click on the image
for the high resolution version.
The light-curve is also availlable as a postscript file
Light-curve Data
|
Epoch
|
1.384 GHz
|
2.368 GHz
|
4.800 GHz
|
8.640 GHz
|
|
(mmmyy)
|
(MJD) |
Flux Density (Jy)
|
Error (Jy)
|
Flux Density (Jy)
|
Error (Jy)
|
Flux Density (Jy)
|
Error (Jy)
|
Flux Density (Jy)
|
Error (Jy)
|
| Jul96 |
50291 |
0.9718 |
0.0298 |
1.1590 |
0.0317 |
1.3240 |
0.0222 |
1.2540 |
0.0190 |
| Oct96 |
50370 |
|
|
|
|
|
|
|
|
| Oct96 |
50371 |
1.0960 |
0.0362 |
1.2230 |
0.1310 |
1.2780 |
0.0607 |
1.2000 |
0.1620 |
| Dec96 |
50431 |
1.0690 |
0.0327 |
1.1760 |
0.0274 |
1.2640 |
0.0488 |
1.1320 |
0.0984 |
| Feb97 |
50488 |
1.0160 |
0.0411 |
1.1180 |
0.0385 |
1.1260 |
0.1020 |
0.9605 |
0.2130 |
| May97 |
50595 |
0.9877 |
0.0335 |
1.1070 |
0.0325 |
1.2040 |
0.0551 |
1.0270 |
0.2020 |
| Jul97 |
50635 |
0.9886 |
0.0573 |
1.1000 |
0.0488 |
1.2260 |
0.0359 |
1.1980 |
0.0414 |
| Sep97 |
50698 |
0.9876 |
0.0549 |
1.1040 |
0.0576 |
1.2020 |
0.0389 |
1.2210 |
0.0409 |
| Nov97 |
50771 |
0.9494 |
0.0444 |
1.0750 |
0.0554 |
1.1840 |
0.0438 |
1.2420 |
0.0362 |
| Dec97 |
50811 |
0.9571 |
0.0526 |
1.0230 |
0.0610 |
1.1480 |
0.0495 |
1.2370 |
0.0562 |
| Feb98 |
50860 |
1.0020 |
0.0496 |
1.0570 |
0.0594 |
1.2150 |
0.0512 |
1.3440 |
0.0394 |
Last updated on Sat Jul 29 18:38:39 UTC 2006
by survey2html version 1.20

