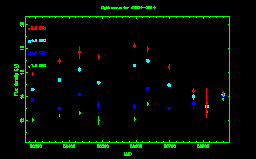
ATCA Flux Density Monitoring Data for J1924-2914
 |
ATCA Flux density light-curve. Click on the image
for the high resolution version.
The light-curve is also availlable as a postscript file
Light-curve Data
|
Epoch
|
1.384 GHz
|
2.368 GHz
|
4.800 GHz
|
8.640 GHz
|
|
(mmmyy)
|
(MJD) |
Flux Density (Jy)
|
Error (Jy)
|
Flux Density (Jy)
|
Error (Jy)
|
Flux Density (Jy)
|
Error (Jy)
|
Flux Density (Jy)
|
Error (Jy)
|
| Jul96 |
50291 |
12.0600 |
0.1200 |
13.7200 |
0.0994 |
14.5800 |
0.0864 |
15.9000 |
0.1350 |
| Oct96 |
50370 |
|
|
|
|
|
|
|
|
| Oct96 |
50371 |
12.4400 |
0.0970 |
13.0500 |
0.1700 |
15.3800 |
0.1200 |
16.9500 |
0.2230 |
| Dec96 |
50431 |
12.6400 |
0.1260 |
14.2100 |
0.1100 |
16.2500 |
0.1650 |
17.6600 |
0.5030 |
| Feb97 |
50488 |
12.0200 |
0.3250 |
13.3000 |
0.3020 |
15.1400 |
0.1140 |
17.2700 |
0.2130 |
| May97 |
50595 |
12.1400 |
0.1060 |
13.1700 |
0.2200 |
16.5600 |
0.1050 |
18.2000 |
0.1640 |
| Jul97 |
50635 |
13.4000 |
0.0996 |
14.6400 |
0.1300 |
16.9600 |
0.0880 |
17.9400 |
0.1870 |
| Sep97 |
50698 |
13.0700 |
0.1290 |
13.0400 |
0.1100 |
14.9300 |
0.0832 |
16.4300 |
0.2070 |
| Nov97 |
50771 |
13.3300 |
0.2000 |
13.4300 |
0.3670 |
14.0000 |
0.1950 |
14.5000 |
0.1380 |
| Dec97 |
50811 |
12.7000 |
0.4610 |
13.9300 |
0.3710 |
13.1700 |
0.5660 |
13.4500 |
1.2100 |
| Feb98 |
50860 |
13.8300 |
0.1140 |
14.1100 |
0.1590 |
14.1500 |
0.1510 |
14.2800 |
0.1800 |
Last updated on Sat Jul 29 18:38:39 UTC 2006
by survey2html version 1.20

