The data on this page are described in detail in
The VSOP 5 GHz AGN Survey: V. Imaging results for the remaining 140
sources
by Dodson et al. in
Astrophysical Journal Supplement, 175, 314-355 (May 2008)
.
Please refer to this paper for details of the observations,
analysis and interpretation.
major minor Brightness
Source S r PA axis axis PA Temperature
name (Jy) (mas) (deg) (mas) (mas) (deg) (10^12 K)
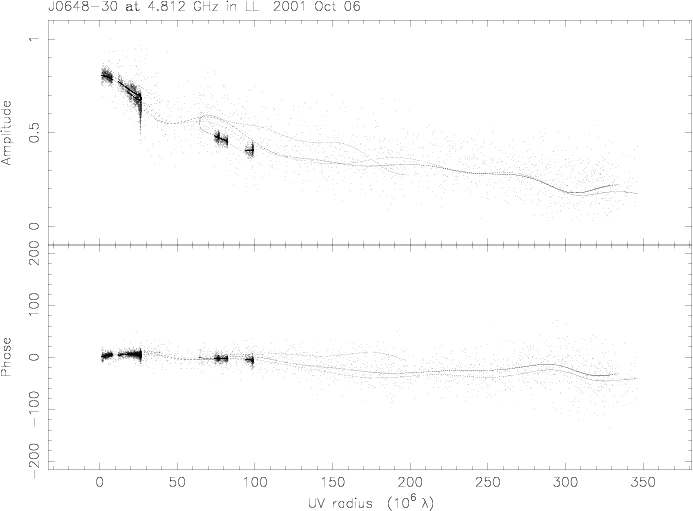
J0648-3044 0.52 0.1 -108 0.4 0.4 ... 0.22
0.18 1.5 121 4.0 3.4 63
0.11 0.8 92 0.5 0.5 ...
Correlated flux density (Jy) vs. projected baseline length plot
png
| ps.gz
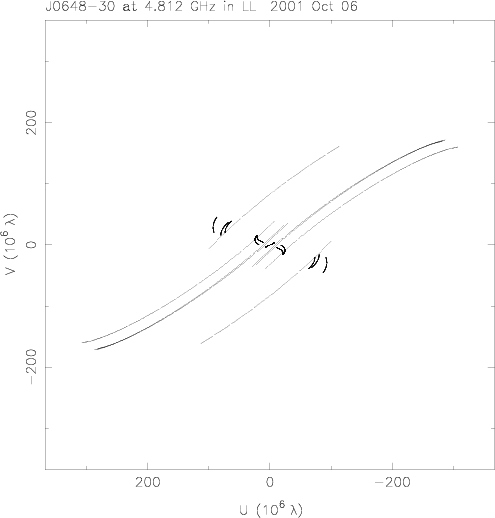
(u,v) coverage for the observation
png
| ps.gz