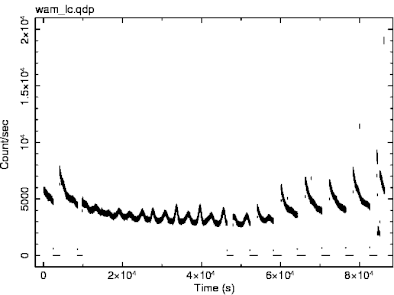
In the current data archive, please note that the WAM data are not screened by some criteria such as during the SAA and calibration. Figure 1.1 shows one-day typical light curve in the 50-5000 keV range.
The high voltages are shut down during the SAA passage (about 10 times
per day), so the light curve shows a zero value at this time. Also the
gain check
operation for each unit is performed during 10 minutes every day (![]() 85000 sec in Figure
1.1), and the light curve shows
about one quarter of the original count rate during this operation.
If the burst occured during and near the SAA and the gain operation,
please take careful not to use the data during these periods.
85000 sec in Figure
1.1), and the light curve shows
about one quarter of the original count rate during this operation.
If the burst occured during and near the SAA and the gain operation,
please take careful not to use the data during these periods.