The number triggered by the WAM after the Suzaku launch.
The GRB name e.x. GRB030329
The GRB triggered date YYYY-MM-DD. Given by UTC.
The GRB triggered time HH:MM:SS. Given by UTC.
The triggered detector boards. WAM 0,1,2 and 3.
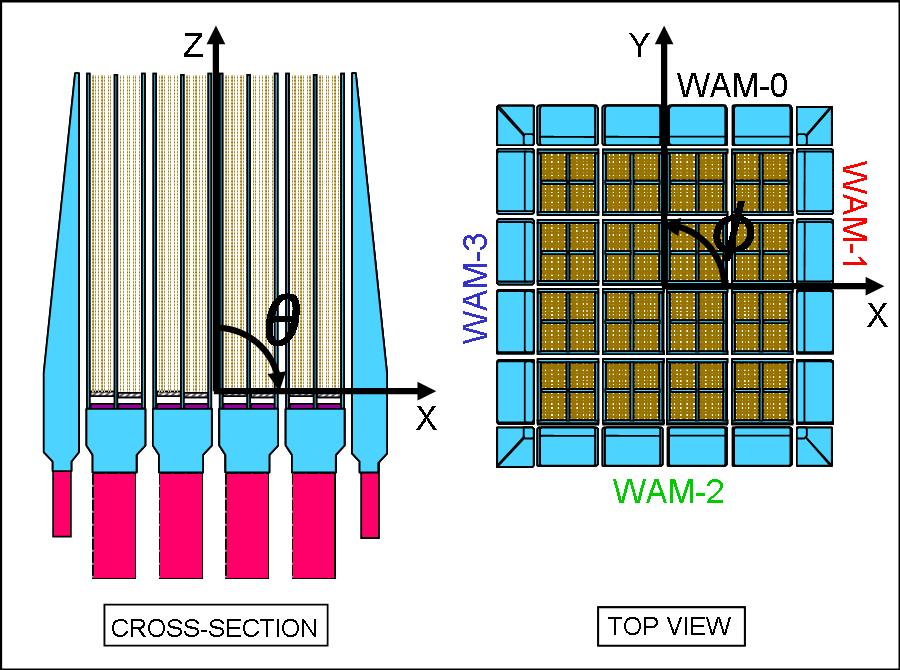
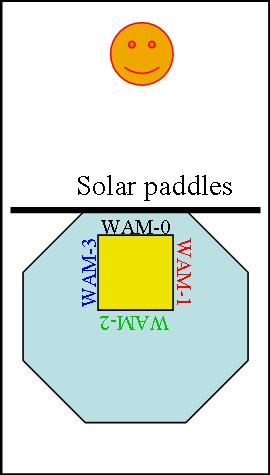
Incident angle (theta and phi) of the GRB to the WAM.
The theta is measured from optical axis of the HXD,
while the phi is defined counterclockwise from the X-axis
of the satellite as shown in the figures below.
The duration of the GRB. T50 and T90 is calculated using the
WAM light curve in 50-5000 keV.
The WAM energy fluence. In unit of erg/cm2.
The integrated energy range is defined by the source intensity.
The light curve data for each detector (WAM 0,1,2 and 3) and
for each energy range
(TH 0,1,2, and 3) is available in GIF, ASCII, and FITS format.
No dead time correction is not made.
The ASCII data format is given by time and counting rate in order.
The spectral data for each detector is also available in
GIF, ASCII, and FITS format.
These spectra are obtained by time-averaging over the duration T90.
GIF, FITS and ASCII format of light curves and spectra.
The GCN Notice list related with the WAM.
Event detected simultaneously with other GRB missions such as Swift, HETE2, Konus-Wind, and INTEGRAL.
Return to
GRB Top
or
Suzaku Home Page.
|